Genes within a genome are never fixed, even for a very short period of time. That’s why we encounter new bacterial variants with novel antibiotic resistance and other phenotypic traits.
Even though genes are continuously acquired from outside or lost over time, orthologous genes can be shared among multiple genomes. If two genomes are closely related or share recent common ancestor, they will share more genes. In contrast, if they are distantly related or share distant common ancestor, the number of shared genes would be less (as they are lost along the way). This is a basis for inferring phylogeny from the gene content information (as presence/absence). Here, “gene” means “CDS”, as this type of analysis is restricted to gene encoding proteins.
Algorithm
After constructing pan-genome from multiple genomes, all CDSs are now clustered into pan-genome orthologous groups (POGs). POG contains at least one CDS (called singleton POGs) and highly conserved POGs are found in all genomes, which comprises the core-genome.
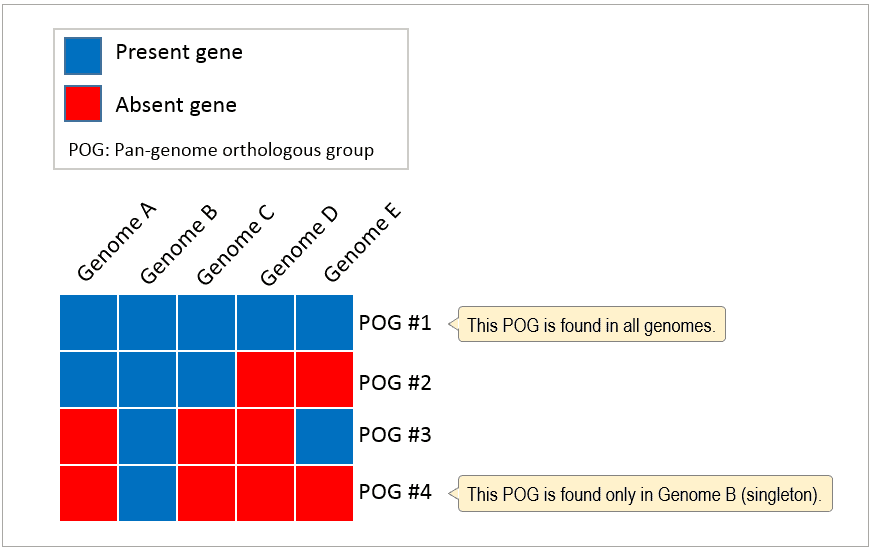
Pan-genome’s gene content information is converted into binary matrix. Presence of a gene is coded as 1 and absence as 0, respectively.

Then, similarity values can be calculated either between two genomes or between two POGs. We use Jaccard coefficient to calculate similarities which is widely used for presence/absence type data.
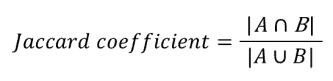
- A: Genes in genome A
- B: Genes in genome B
Jaccard coefficient is a similarity index ranging from 0 (complete different) to 1 (same). The resulting similarity matrix of Jaccard coefficient is used for clustering by UPGMA algorithm.
In EzBiocloud, two different calculations are provided:
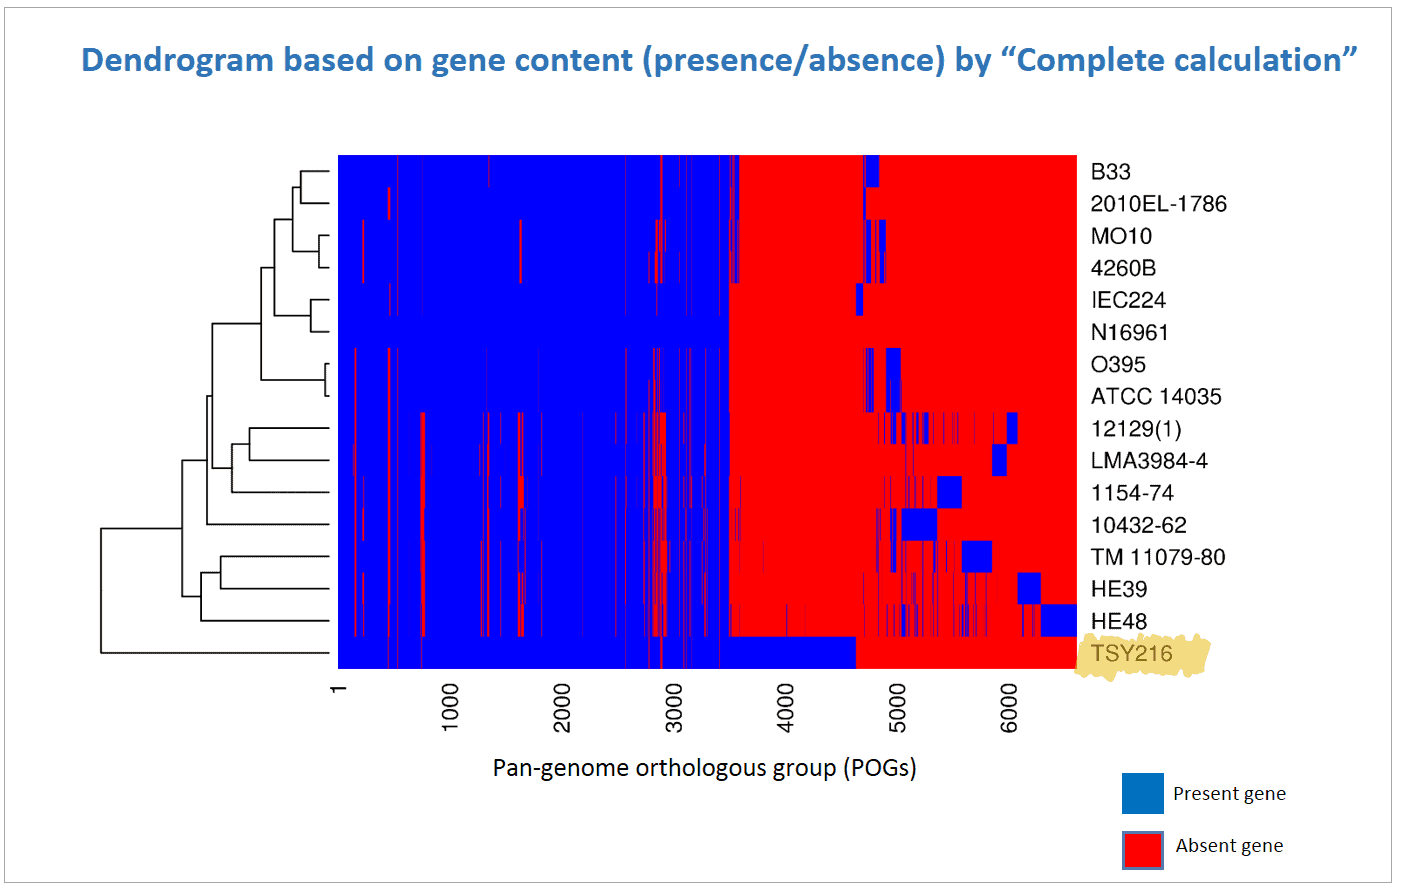
- Complete calculation: Analysis based on all POGs
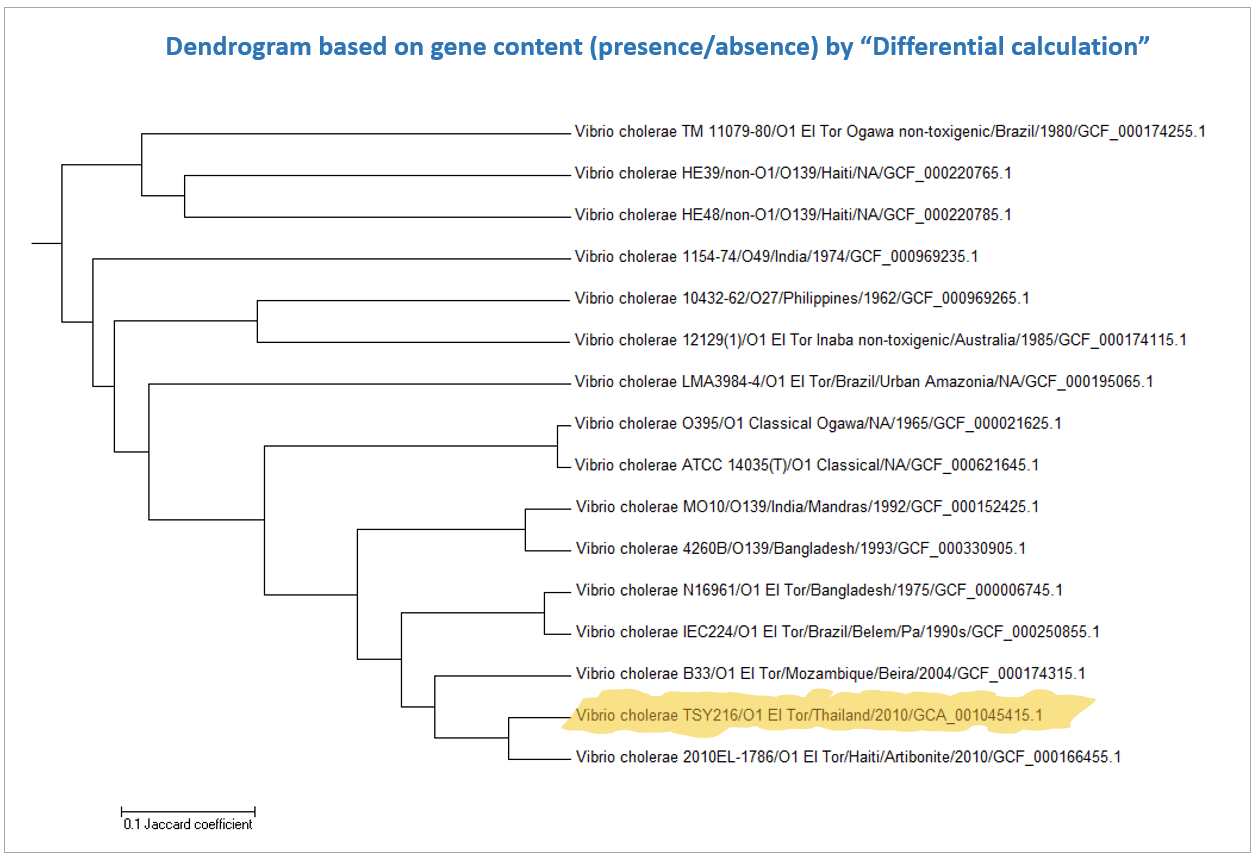
- Differential calculation: Analysis based on POGs excluding those present in all genomes (core-genome) and singletons (present in single genome). In the above case, POGs #1 and #4 are excluded for this type of analysis.
As seen in the chart below (C. psittaci pan-genome), most POGs are either core-genome or singletons. Therefore “Differential calculation” is much faster than “Complete calculation”.

How to interpret
Will there be a big difference between these two types of calculations? Yes, sometimes.
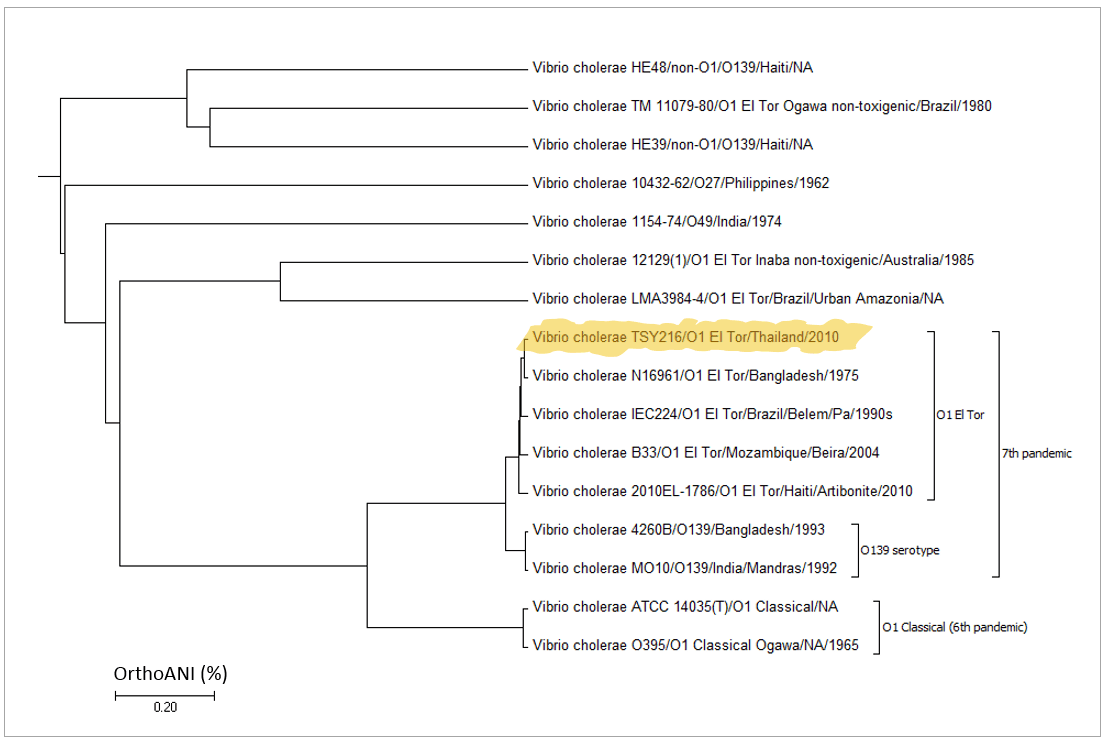
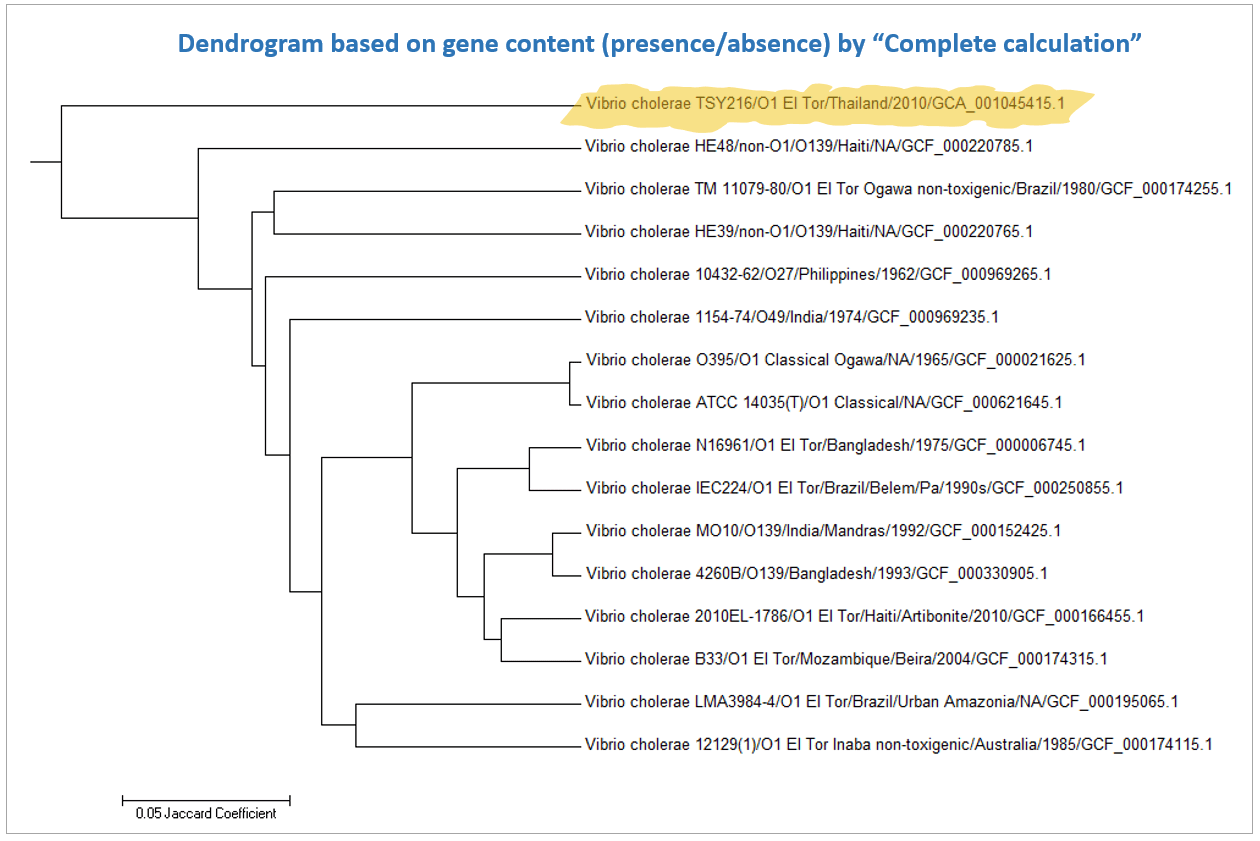
Below is a case for Vibrio cholerae strain TSY216, which is a clone of 7th pandemic clade. In the OrthoANI dendrogram, it shows that the genome sequences are very similar to other 7th pandemic strains. However, TSY216 is a very different strain from all of V. cholerae strains in the dendrogram based on the gene content with “Complete calculation”. This is due to the fact that TSY216 has a large number of strain-specific genes (>1,000) which were introduced recently into its genome via lateral gene transfer of a mega-plasmid. Since these strain-specific genes are mostly excluded in “Differential calculation”, TSY216 is back to the right place in the dendrogram based on the gene content with “Differential calculation”. You can try this by yourself using the provided tutorial here.
Heat map analysis
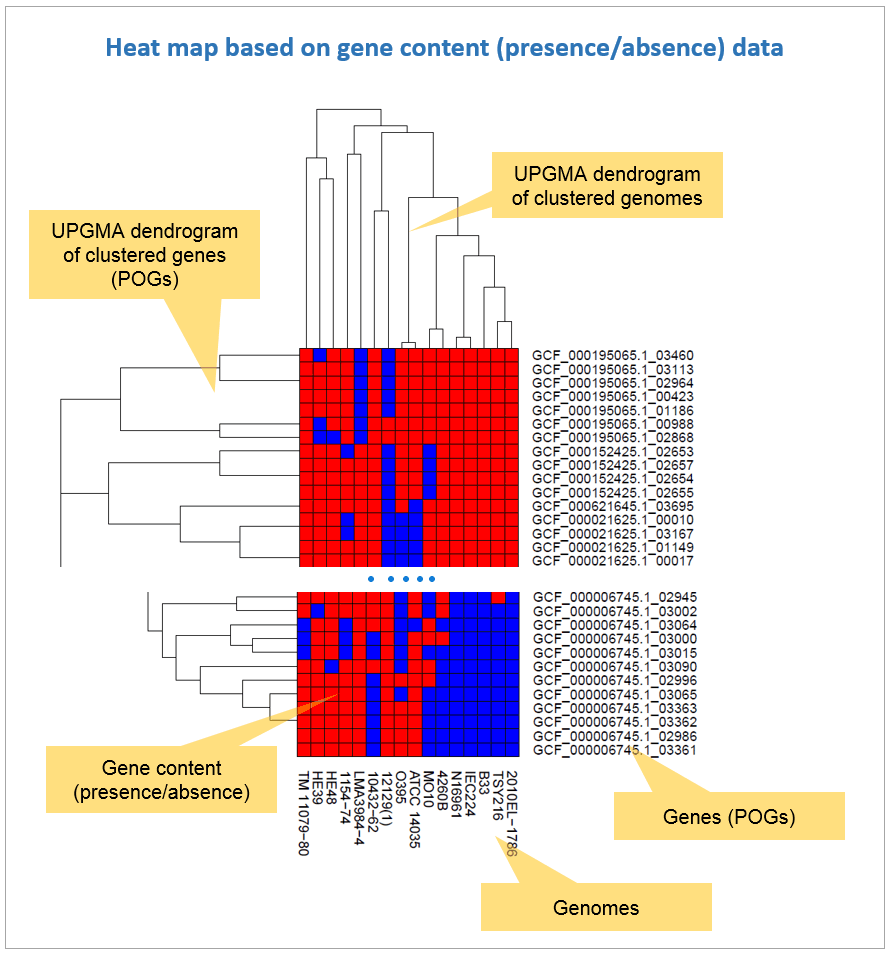
Gene content (presence/absence) data together with clustering can be used to generate heat maps. In EzBioCloud, UPGMA clustering is carried out for both genomes and POGs (genes). In other words, genomes are clustered using presence/absence of genes (as shown in all of the above examples) and genes are clustered using presence/absence of genomes. A typical heat map like the one below was generated by clustering genomes. You can easily notice that there are ~1,000 extra genes in strain TSY216.
The following heat map was generated by clustering sides from both genome and gene with “Differential calculation”.
All figures in this article were provided by http://cg.ezbiocloud.net/.
Last updated on May 10th, 2016 (EK)

