In descriptive statistics, a box plot or boxplot is a visualization method for graphically depicting groups of numerical data through their quartiles. Here, we will explain the typical types of box plot used in the EzBioCloud and EzBioCloud services.

- Median: In the box plot, the median is displayed rather than the mean.
- Q1: The first quartile (25%) position.
- Q3: The third quartile (75%) position.
- Interquartile range (IQR): a measure of statistical dispersion, being equal to the difference between 75th and 25th percentiles. It represents how 50% of the points were dispersed.
- Lower and upper 1.5*IQR whiskers: These represent the limits and boundaries for the outliers.
- Outliers: Defined as observations that fall below Q1 − 1.5 IQR or above Q3 + 1.5 IQR. Outliers are displayed as dots or circles.
Box plot without outliers
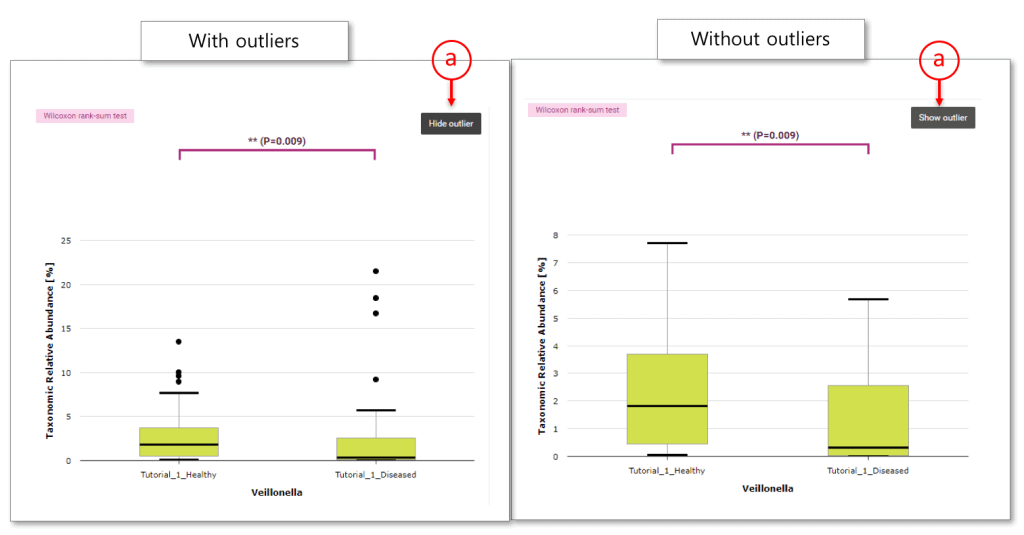
Sometimes, you may want to see the distribution without displaying extreme outliers that would squeeze the chart. You can quickly redraw the box plot by excluding outliers, whereever the function is available.
In this example, the relative abundances of the genus Veillonella between two MTP sets (Tutorial_1_healthy and Tutorial_1_Diseased) are used to draw the box plots. (a) is the button to toggle the option for excluding outliers.
Last updated on April 17, 2020


