The genome map is a circular representation of one or several genomes that provides a quick and easy way to spot global patterns, large features, or regions of interest based on various metrics. Visualizing all features at the genomic scale can aid in understanding the organization of a genome, or the similarities and differences across multiple genomes.
The genome map is a circular representation of one or several genomes that provides a quick and easy way to spot global patterns, large features, or regions of interest based on various metrics. Visualizing all features at the genomic scale can aid in understanding the organization of a genome, or the similarities and differences across multiple genomes.
Single Genome Map

The single genome map presents a pseudogenome comprised of all assembled contigs, including plasmids found in the bacterium. The colored bands in Section 1 represent contigs, each of which can be clicked to reveal only the features within that contig. Section 2 represents the annotated reference genes (specifically, CDSs) found in the forward strand, and Section 3 represents the same information in the reverse strand. Different colors were assigned to indicate COG functions (more details). Section 4 displays only rRNA and tRNA found in this genome. Section 5 displays the GC skew metric, which can be used as an indicator for identifying replication loci and leading/lagging strands. The genomic mean GC-skew value is used as the baseline, relative to which higher-than-average values are displayed in green, whereas lower-than-average values are displayed in red. Finally, Section 6 displays the GC ratio metric, which can be used to profile the genome, identify isochores, or observe co-variations with other data. GC ratio also uses the genomic mean GC ratio value as its baseline, with higher-than-average values in blue and lower-than-average values in yellow. Both GC skew and GC ratio metrics are displayed at 10kb intervals, but this window decreases to 1kb when the feature being examined is below the megabase scale (plasmids, for instance).
The center of the map contains the reference genome’s name and a drop-down menu that can be used to select a single contig for rendering.
Multi-Genome Map
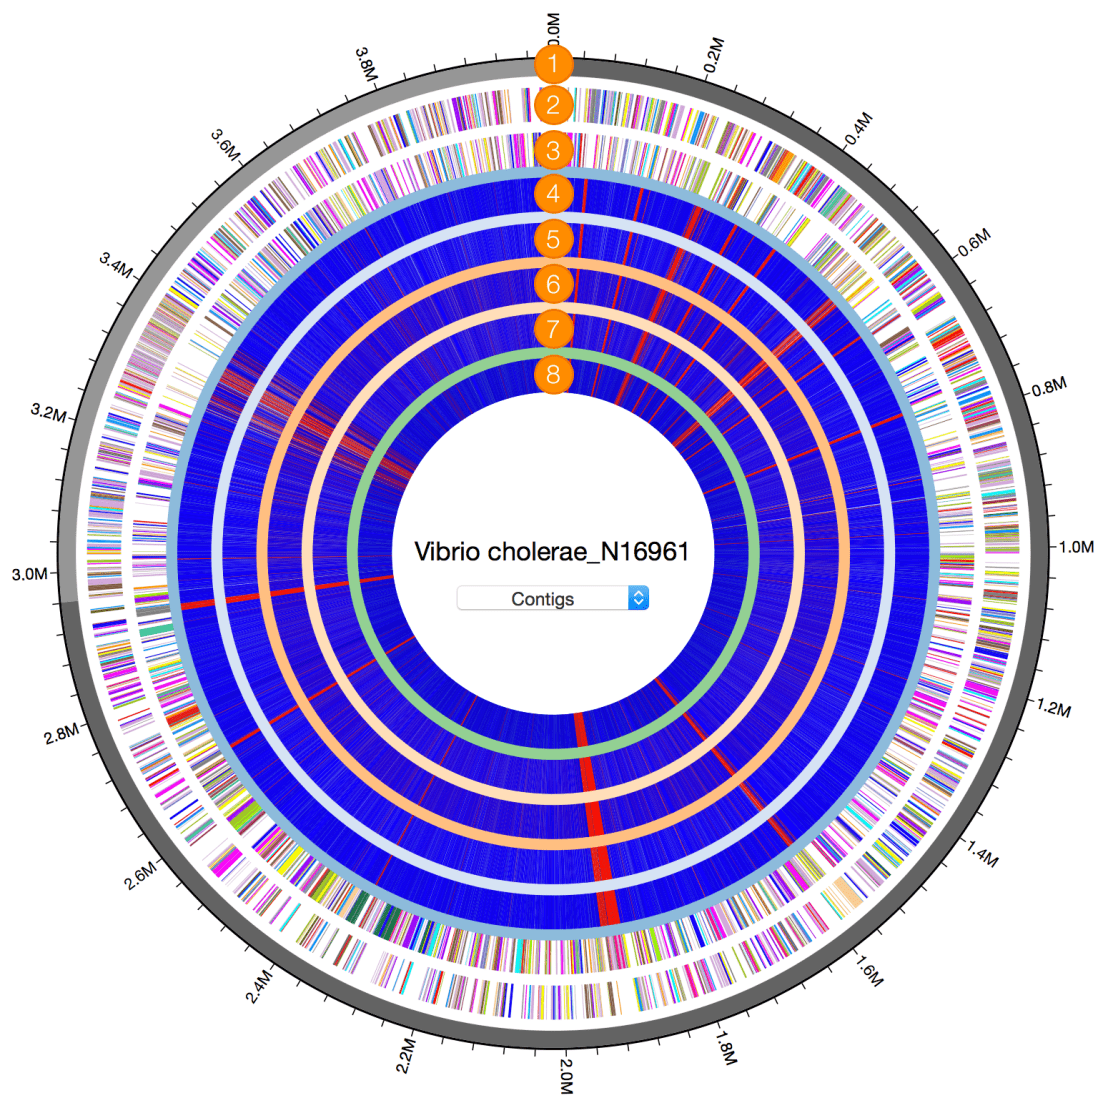
The multi-genome map primarily presents a reference pseudogenome, against which subsequent genomes are compared. Like the single genome map, Section 1 represents contigs, and Sections 2 and 3 are the annotated reference genes (CDS) for the forward and reverse strands of the reference genome, respectively. Sections 4 through 8 represent other genomes. Hovering over the colored bands will indicate which genome information is displayed on that particular track. The blue and red bands inside each track represent a presence/absence analysis of genes in that sample genome, relative to the reference genome.
The center of the map contains the reference genome’s name and a drop-down menu that can be used to select a single contig for rendering.
Last Updated 09/06 (SJK)

